UC Santa Barbara > History Department > Faculty > Prof. Marcuse > Courses > ESCI Scores page

Prof. Marcuse's ESCI
Scores Page

page compiled by Harold Marcuse
(professor of German history at UC Santa Barbara)
Harold Marcuse homepage, Courses page

created Jan. 9, 2008, updated July 15, 2013


Introduction
Table of
ESCI scores
Scans of
Reports
Links

Introduction (back to top)

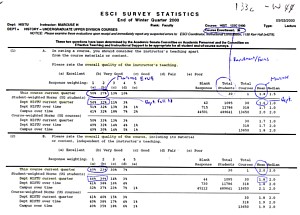
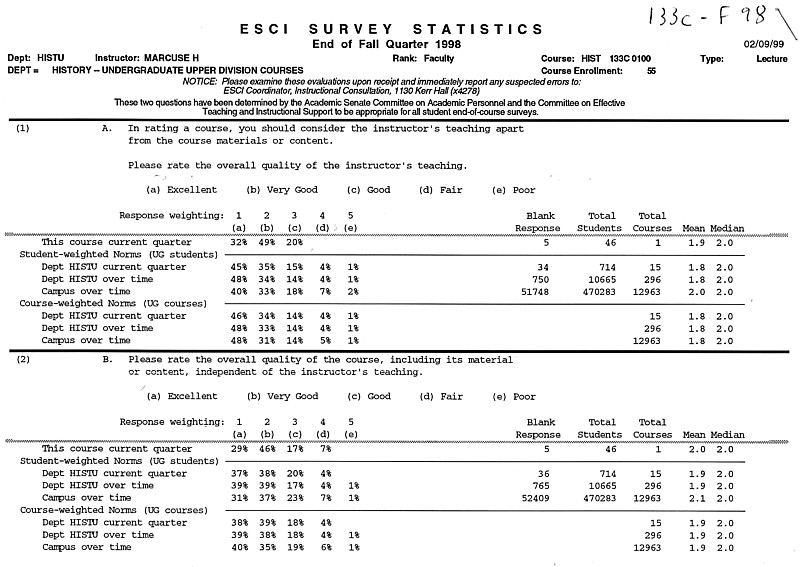
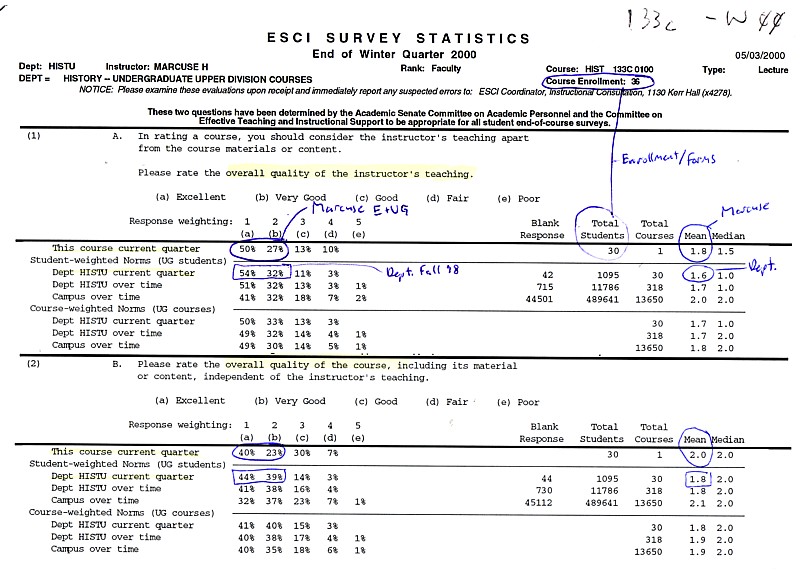
  • At UCSB students evaluate their professors and instructors by filling out ESCI (Evaluation System for Courses and Instruction) forms at the end of each quarter.
  • Two questions are common to all courses; students rate them on a scale of 1=excellent to 5=poor:
    1. Please rate the overall quality of the instructor's teaching.
    2. Please rate the overall quality of the course, including its material or content, independent of the instructor's teaching.
  • The results of these surveys are compiled for each instructor, department, and campuswide. For each course, instructors receive printouts of their own results, with comparison figures for their own department, and for the whole campus, both during the same quarter, and over time (It might be a 3- or 5-year horizon).
  • In the History department, the departmental and campuswide comparisons are further broken down so that lower-division courses are compared only with all other lower-division courses, and upper-division with all other upper-division courses.
  • Additionally, there are "course-weighted" and "student-weighted" comparison figures. The former is like the US Senate: each course (state) gets the same number of votes, no matter how many people are in it. The student-weighted scores give more votes to large courses, proportional to the number of students enrolled.
  • Sound complicated? It isn't really. I include scans of result printouts below so you can look them over. The UCSB Office of Instructional Consultation also explains the ESCI system in detail.

Prof. Marcuse's ESCI scores over time, with departmental comparison
(back to top)

Explanation of table (comparisons are cols. 3&4 and cols. 5&6):

  • The Enrollment column indicates the number of forms filled out over the total official enrollment of the course.
  • The Quality of Teaching column gives the answers to ESCI Question 1 (Substance of lectures), first as the combined percentage of students answering 1 and 2 (excellent and very good), then in parentheses the mean score (on a scale of 1-5, with a lower score being better).
    Both my figures, and the student-weighted comparison figures for the whole History Department that same quarter are given.
  • Ditto for the Quality of Course (independent of instruction) column.
  • I give the data this way because this is how my department reports it in its evaluations of my performance.

Course-Qtr

Enrollment

(responses/total)

Quality of Teaching
   Marcuse | Department
E+VG (mean) | E+VG (mean)

Quality of Course
   Marcuse | Department
E+VG (mean) | E+VG (mean)

4c-S00

156/312=50%

46% (2.6)

43% (2.7)

48% (2.6)

49% (2.5)

2c-S03

     /109

     (2.3)

     (2.1)

     (2.5)

     (2.2)

2c-S06

154/220=70%

52% (2.5)

71% (2.0)

45% (2.6)

66% (2.1)

2c-S08

305/461=66%

36% (2.9)

72% (2.0)

48% (2.6)

73% (2.0)

2c-F09

129/252=51%

53% (2.5)

72% (2.0)

43% (2.5)

60% (2.3)

2c-F11

207/406=51%

52% (2.5)

63% (2.3)

57% (2.4)

63% (2.3)


33d-F02

     /90

       (1.3)

     (1.9)

     (1.5)

     (2.1)

33d-F03

39/43

100 (1.4)

81 (1.8)

98 (1.4)

72 (2.0)

33d-F05

28/28

 79 (1.9)

72 (2.0)

86 (1.6)

66 (2.2)


Upper division


133A-F06

27/35

92 (1.6)

82 (1.7)

82 (1.9)

78 (1.9)


133B-W07

31/34+91%

90% (1.4)

102% (1.6)

96% (1.5)

84% (1.7)

133B-W09

41/47=87%

98% (1.5)

87% (1.6)

96% (1.6)

84% (1.7)

133B-W11

30/38=79%
90% (1.7)
88% (1.5)
90% (1.4)
83% (1.7)


133C-F98

41/55

81 (1.9)

80 (1.8)

75 (2.0)

75 (1.9)

133C-W00

30/36

77 (1.8)

86 (1.6)

63 (2.0)

83 (1.8)

133C-W04

30/33

90 (1.4)

85 (1.7)

87 (1.6)

82 (1.8)

133C-W06

22/31

96 (1.5)

82 (1.7)

96 (1.5)

80 (1.8)

133C-S07

36/43

97 (1.3)

84 (1.7)

89 (1.5)

81 (1.8)

133C-F08

40/50=80%

86% (1.8)

76% (1.9)

85% (1.8)

86% (1.9)

133C-S11

37/45=82%

79% (1.9)

80% (1.8)

73% (2.0)

75% (1.9)


133D-F01

42/52=81%

95% (1.4)

82% (1.8)

97% (1.3)

77% (1.9)

133D-W08

30/38=79%

90% (1.7)

88% (1.5)

90% (1.4)

83% (1.7)

133D-W10

52/56=93%

80% (1.8)

84% (1.6)

84% (1.8)

83% (1.7)

133D-W12

35/41=85%

88% (1.6)

89% (1.6)

82% (1.8)

82% (1.7)

133D-S13

/41


note: these are all of the lecture courses I taught since Spring 2000 for which I could find data.


Fall 1998, 133C--results for Questions 1&21998 ESCI scores for Marcuse

Winter 2000, 133C--this was not one of my better quarters. The data given in the table above is marked.


Links (back to top)


page created by Harold Marcuse on Jan. 9, 2008; last update: see page header
back to top; Harold Marcuse homepage