UC Santa Barbara > History Department > Faculty > Prof. Marcuse > Courses > Grading Data & Policies page
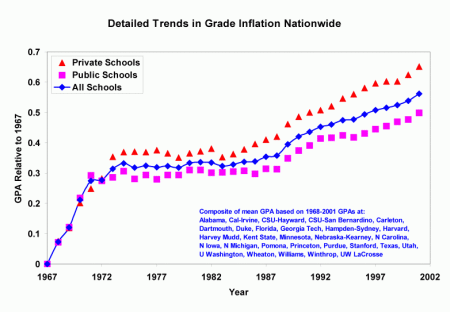
graph of grade inflation, 1967-2002

Prof. Marcuse's Grading Data & Policies Page

page compiled by Harold Marcuse
(professor of German history at UC Santa Barbara)
Harold Marcuse homepage, Courses page


created Jan. 8, 2008, updated 6/24/08


Introduction
Grading Policies
Hist 2C Grade
Distributions
Hist 33D Grade
Distributions
Hist 133 A,B,C,D Grades
Grading
Links

Introduction (back to top)

  • Students are often interested in how "hard" a given professor grades relative to others. I offer below some tables I published on my various course websites that show the final distribution of grades in many of my lecture courses since 2002.
  • Hist 2C and 33D are lower division (freshman and sophomore) lecture courses, with the grades in 2C, a large survey course, being given by 2-5 TAs each offering.
  • Hist 133A,B,C & D are my upper division (junior and senior level) lecture courses on 19th and 20th century German history.
  • I use a point system (usually 100 max with some extra credit) to compute the grades, and "curve" the grades, using natural breaks in the point distributions to draw the line between different grades.
  • I include the following Grading Policies on my course websites:

Grading Policies (back to top)

If you are think your grade does not reflect your work and effort:

  • First, please note that I grade YOUR WORK, not you.
  • If you feel that the grade you received on your paper or exam does not correspond to the quality of work that you submitted, or the effort you put into it, you have two options:
    1. Print out, complete, and submit the following Grade Change Application Form ;-),
      OR:
    2. Write a page (or paragraph, whatever it takes) explaining WHY you think your work is better than the grade assigned to it. Please refer to the appropriate assignment sheet or text in the syllabus, and make sure you did the assignment.
      • Then resubmit the work in question with your explanation, and I will regrade it and get back to you.
      • Be sure to put some contact e-mail or address on your explanation sheet, so that I can be in touch with you.
      • Note that I reserve the right to lower your grade, if I feel that is warranted by closer examination.

Hist 2c Grades (back to top)

  • June 13, 2003: On June 22 you can find out your course grade from GOLD.
    Here is the overall grade distribution for my Spring 2003 Hist 2C course :
    total #: 108 B+    29 C+   8 D+    0 F       2
    A      7 B      19 C     7 D      0 withdraw/incomplete: 0
    A-   23 B-    13 C-   0 D-     0 mean grade: 86.2
    28% As
    56% Bs
    14% Cs
  • June 21, 2006: Here is the overall grade distribution for Spring 2006 Hist 2C:
    (this table shows the number of students receiving each grade)
    total #: 227
    B+    26 C+   20 D+    1 F     6
    A     19 B      61 C       8 D      1 withdraw/incomplete: 3
    A-   37 B-    39 C-     8 D-     1 mean grade: 85.0 (w/o Fs)
    25% As
    56% Bs
    16% Cs
    1% Ds
  • June 24, 2008: Here is the overall grade distribution for Spring 2008 Hist 2C:
    (468 total students):
    A+     8
    B+    59 C+   30 D+    4 F     9
    A     51 B     117 C     36 D      2 withdraw/incomplete: 2
    A-   77 B-     68 C-     5 D-     0 mean grade: 85.4 (w/o Fs)
    29% got As
    52% got Bs
    15% Cs
    1% Ds

Hist 33D Grades (back to top)

  • Dec. 18, 2002: Grade distribution
    (point range without 10% participation: 82=A to 57=C-):
                     # students 72-74pts=B+    14 63-64pts=C+   3 D    2  
    78-82pts=A    16 68-71pts=B      18 60-61pts=C     3 D-  2 missing/incom.: 6
    75-77pts=A-   13 65-67pts=B-      3 57-59pts=C-   3 F    3 total:   86
  • Dec. 15, 2003:
    The final grade distribution is as follows
    (point totals are WITHOUT the 10 participation pts):
                     # students 77-79pts=B+     9 67-69pts=C+   2 D    0  
    83-85pts=A    12 73-76pts=B       5 64-66pts=C     2 D-  0 missing/incomplete: 2
    80-82pts=A-    9 70-72pts=B-     3           pts=C-   0 F    0 total:   44
  • Dec. 15, 2005: The final grade distribution is as follows
    (A: 28%; A-: 46%; B+, B, B-: 7% each ):
                     # students 75-76pts=B+     2 55-68pts=C+   1 D    0  
    81-92pts=A     8 70-74pts=B       2               =C     0 D-  0 missing/inc.: 0
    77-80pts=A-  13 65-69pts=B-     2               =C-   0 F    0 total: 28 students

Hist 133 A,B,C,D Grades (back to top)

  • Mar. 23, 2004: Here is the distribution of grades for the Winter 2004 Hist 133C course according to the raw point score without the participation grade (95 possible points [well 101, if you count the double extra credit for the outside events]):
                   # students 86-85pts=B+     2 75-71pts=C+   4 D   0  
    94-90pts=A    5 84-80pts=B      10 70-62pts=C     2 D-  0 graduate student: 1
    89-87pts=A-   5 79-76pts=B-      4           pts=C-   0 F    0 total:   33
  • Mar. 29, 2006: Here is the distribution of grades for the Winter 2006 Hist 133C course according to the raw point scores (see note on grading, below):
                      # students 87-89pts=B+   6 77-78pts=C+   2 62-67pts=D   2  
    93-100pts=A    6 83-86pts=B     2 71-76pts=C     3                 F    1  
    90-91pts=A-    2 79-82pts=B-    5 68-70pts=C-   1 incomplete:     1 total:  31
  • Dec. 20, 2006:
    Here is the distribution of grades for the Fall 2006 Hist 133A course according to the final point distribution:
                   # students 85-86pts=B+    6 75 pts    =C+  1 62pts=D    1  
    90-94pts=A    7 79-82pts=B      7 69pts     =C    1            F    2  
    87-88pts=A-  5 77     pts= B-    3 67pts     =C-   1 incomplete: 1 total:  35
  • Mar. 28, 2007: Here is the distribution of grades for the Winter 2007 Hist 133B course according to the final point distribution:
                   # students 79-82pts=B+   6      74 pts=C+  1 42-59pts=D   2  
    87-91pts=A   12 77-78pts=B      2 70-73pts =C    4                  F   0  
    83-86pts=A-   8 75-76pts=B-    0 65-69pts =C-   0 incomplete:     0 total:  35
  • June 20, 2007: The grade distribution for Spring 2007 Hist 133C is:
                   # students 86-89pts=B+   6 77     pts=C+   3                 D   0  
    94-107pts=A  14 84      pts=B     2 70-74pts=C     6                 F    0  
    90-93pts = A-  4 79-81pts=B-    7 64      pts=C-   1 incomplete:     0 total:  43
    The mean (average) grade was 86.0, and the median was 87.
  • March 31, 2008: Here is the distribution of grades for my 2008 Hist 133d course according to the final point scores:
                     # students 86-87pts=B+   2                 C+   0                 D   0  
    93-108pts=A  23 84pts     =B      2 69-70pts=C     1                 F    0  
    89+-92pts=A-  6 81-82pts=B-    3                 C-    0 incomplete:     0 total:  37

Links (back to top)

  • Interested in grade inflation since the 1970s, all across the USA?
    Check out this website: www.gradeinflation.com. On the second-to-last graph, the one with the scattered points, you'll find UCSB below the blue line at the 10-year time span. The researcher got data from UCSB's Office of Budget and Planning showing that our campus GPA went from 2.84 in 1994 to 2.93 in 1999.
  • Page of grade inflation links by Prof. D. Larry Crumbley, an accounting professor at Lousiana State University's Business School


page created by Harold Marcuse on Jan. 8, 2008; last update: see page header
back to top; Harold Marcuse homepage